Cryptocurrency markets are thrilling, unstable, and fast-paced. But to trade profitably, you can’t just be enthusiastic but also need something else: a knowledge of crypto charts. Crypto charts aren’t just pretty pictures; they’re the secret to making informed trades. Whether you’re a complete beginner or you wish to take your skills to the next level, this manual will walk you through everything you need to know, from basics to advanced methods.
What are Crypto Charts?

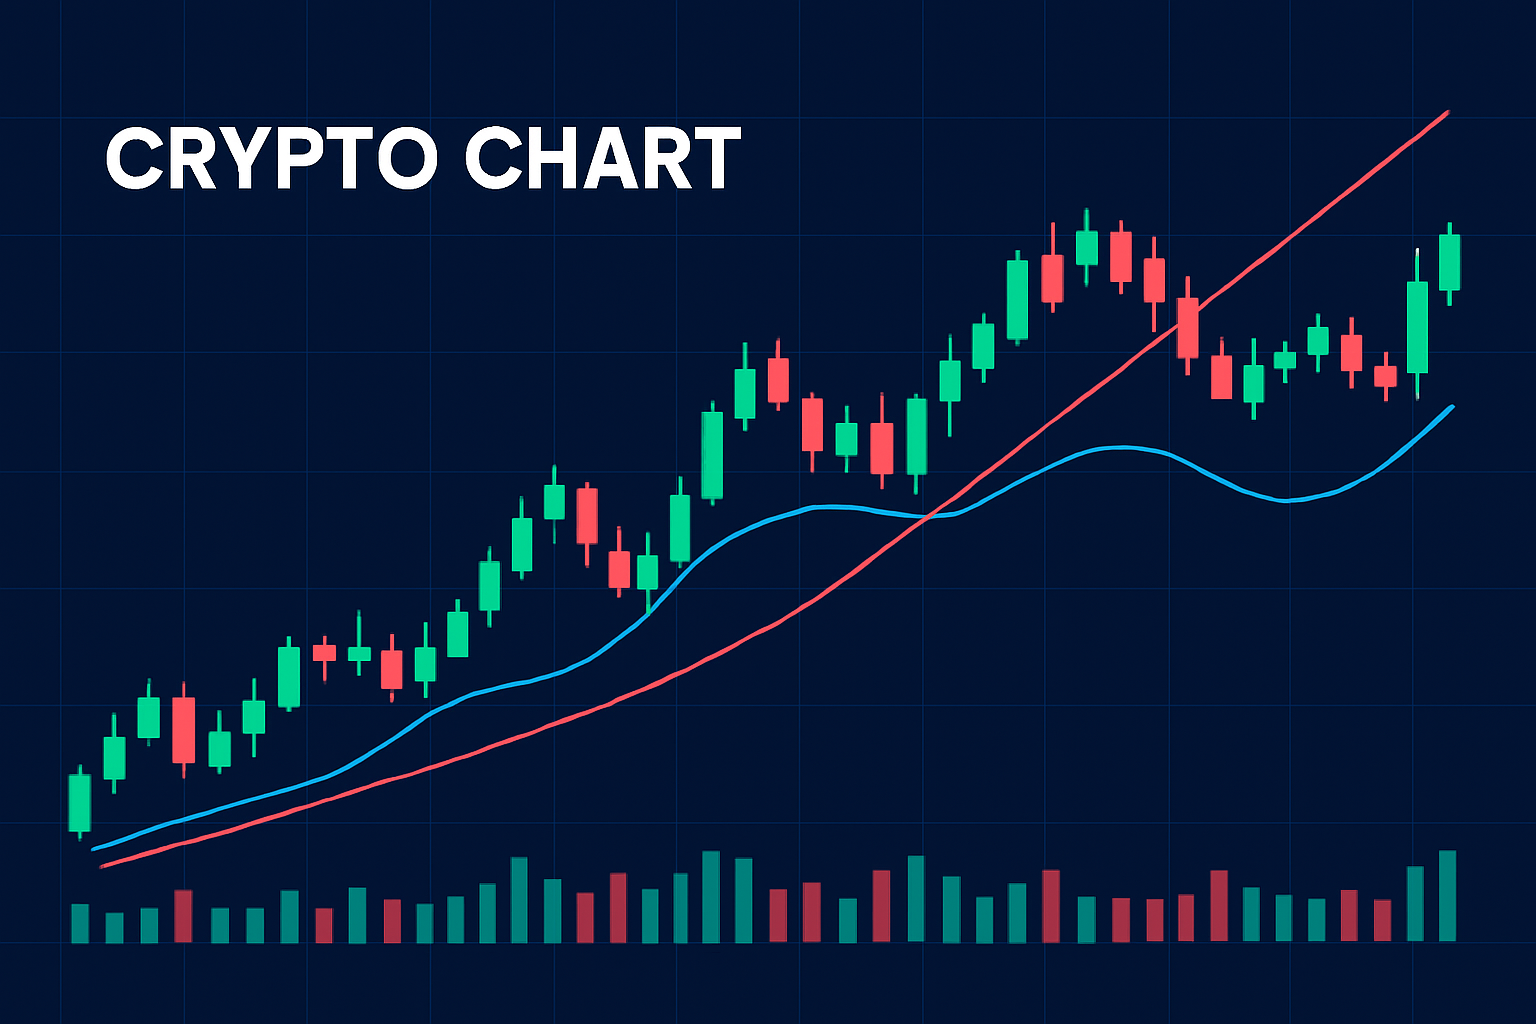
Crypto Charts are visual representations of a cryptocurrency’s price movement over a period of time. The crypto charts are used by traders to identify patterns, make predictions, and determine when to sell or buy. Most charts graph the price (Y axis) against time (X axis). They can, however, also depict other indicators like volume, volatility and momentum. The most popular types of charts include:
- Line charts
- Bar charts
- Candlestick charts
Among them, the most widely utilized in crypto trading are candlestick charts.
Why Are Crypto Charts Important?
Crypto charts are valuable to investors and traders as they:
• Reveal market sentiment
• Highlight trends
• Point to support and resistance levels
• Help with risk management
• Make it easier to develop entry and exit strategies
Trading without charts is equivalent to trading blind.
Read Also: How to Read a Crypto Chart in English – Made Simple for Saudi Traders
Basic crypto Charts Types Explained
- Line chart
This chart is the basic one among the rest, it connects the closing prices over a time period with a continuous line.
Advantages:
- Simple
- Easy to understand
- Good for identifying long-term trends.
Disadvantages:
- Lacks detailed information such as opening and high/low prices
2. Bar Chart
A bar chart includes more data such as opening, closing, high, and low prices for each period.
Each bar shows:
- Top: High price
- Bottom: Low price
- Left tick: Opening price
- Right tick: Closing price
3. Candlestick Chart
Candlestick charts are most commonly applied in crypto trading.
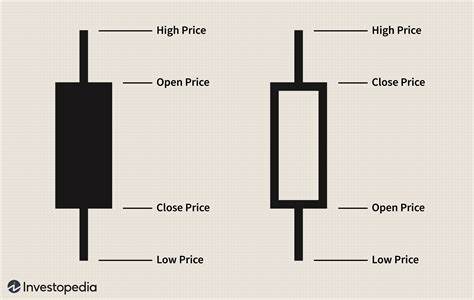
Each candlestick has:
- Body: Difference between opening and closing price
- Wick (or shadow): High and low of the period
- Color: Indicate direction (usually green for up, red for down)
Candlestick patterns show revealing information about market psychology.
Understanding Time Frames
Crypto charts can be shown in various time scales, which range from 1-minute to month charts. The choice depends on your trading plan:
• Scalpers use 1-minute or 5-minute charts for trading
• Day traders use 15-minute to 1-hour charts for trading
• Swing traders use 4-hour to daily charts for trading
• Long-term investors use weekly or month charts
Each time scale tells a different story. It is common to check multiple time frames to get a better idea.
Reading Candlestick Patterns

Here are some of the most important candlestick patterns that every trader needs to know:
- Doji
The open and close are nearly the same, showing indecision in the market. A Doji after a strong trend may indicate a reversal.
2. Hammer and Inverted Hammer
- Hammer: Bullish reversal pattern after a downtrend. Small body with a long lower tail.
- Inverted Hammer: Also bullish, but long upper tail.
3. Shooting Star
A bearish reversal candle after an uptrend. Small-bodied with an extensive upper wick.
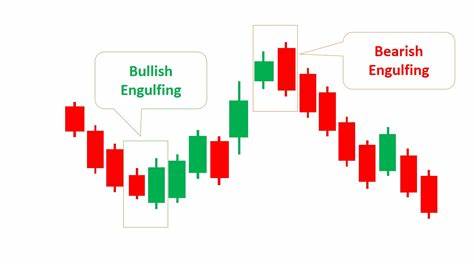
4. Engulfing Pattern

• Bullish Engulfing: A small red candle followed by a subsequent large green one which fully “engulfs” the previous one.
• Bearish Engulfing: A small green candle followed by a subsequent large red one.
These are more powerful with strong trading volume backing.
Read also: Top 5 Mistakes Every New Crypto Trader Makes (and How to Avoid Them)
Key Concepts: Support and Resistance
Support and resistance are the foundation of technical analysis:
- Support: A price level where demand is strong enough to prevent a downward price drop.
- Resistance: A price level where the selling pressure prevents the price from rising.
Price changes between such levels. A break at support or resistance can indicate a reversal or continuation of a trend.
Volume Analysis
Volume indicates how much of a cryptocurrency was exchanged during a certain period. It serves to confirm the strength of a trend.
- Large volume + price action = strong trend
- Weak volume + price movement = weak trend
An increase in volume can signal the beginning of a new trend or the end of an existing one.
Trend Lines and Channels
Trend Lines
Trend lines link successive higher lows (in an advancing market) or lower highs (in a declining market). Trend lines help in visualizing the market’s direction.
Channels
If you draw a line parallel to the trend line on the opposite side of the price action, you get a channel. Channels can be applied to mirror the range in which price is moving.
Moving Averages (MA)
Moving Averages smooth out price data to help in establishing the direction of the trend.
Common Types:
• Simple Moving Average (SMA): Weighted average price over a given duration
• Exponential Moving Average (EMA): Gives more weight to recent prices
Popular Settings:
- 50-day MA: Mid-term trend
- 200-day MA: Long-term trend
- 9-day or 20-day EMA: Short-term trend
Golden Cross and Death Cross:
- Golden Cross: 50 MA crosses above 200 MA – bullish signal
- Death Cross: 50 MA crosses below 200 MA – bearish signal
Relative Strength Index (RSI)
The RSI is a momentum oscillator that moves between 0 and 100.
- Above 70: Overbought (potential sell signal)
- Below 30: Oversold (potential buy signal)
RSI helps detect overextended price moves that could reverse soon.
MACD: Moving Average Convergence Divergence
The MACD utilizes two moving averages to signal changes in momentum.
It includes:
• MACD Line
• Signal Line
• Histogram
Key Signals:
• MACD crosses Signal Line: Bullish
• MACD crosses Signal Line: Bearish
The histogram shows the strength of the move.
Fibonacci Retracement
Fibonacci retracement levels are used to predict potential reversal levels during pullbacks.
Common retracement levels:
- 23.6%
- 38.2%
- 50%
- 61.8%
- 78.6%
Traders use these levels to enter trades during corrections in an overall trend.
Read More: how to use fibonacci retracement the right way in crypto TRADING
Bollinger Bands
Bollinger Bands consist of:
• A middle band (SMA)
• An upper band (SMA + standard deviation)
• A lower band (SMA – standard deviation)
Interpretation:
• Pricing at upper band: Overbought
• Pricing at lower band: Oversold
• Bands constricting: Low volatility, breakout imminent
• Bands expanding: High volatility
Chart Patterns: Visual Roadmaps
Chart patterns have a tendency to forecast future price movement. Some important ones include:
Continuation Patterns
- Triangles (ascending, descending, symmetrical)
- Flags and Pennants
- Rectangles
They indicate that the trend will persist after a short pause.
Reversal Patterns - Head and Shoulders
- Double Top/Bottom
- Rounding Bottom
These patterns suggest a change in the trend direction.
Advanced Techniques
- Divergence
Divergence occurs when the price goes one way, but an indicator (such as RSI or MACD) goes in the opposite way.
• Bullish divergence: Price forms lower lows, yet RSI forms higher lows
• Bearish divergence: Price forms higher highs, yet RSI forms lower highs
This can be a sign of a trend reversal. - Ichimoku Cloud
A complex indicator that gives information on support, resistance, trend, and momentum at a glance.
It is made up of several lines:
• Tenkan-sen (conversion line)
• Kijun-sen (base line)
• Senkou Span A & B (cloud boundaries)
• Chikou Span (lagging line)
The trend is bullish when the price is within the cloud and vice versa. - Volume Profile
Shows the volume traded at each price level, not by time alone. Helps in identifying crucial areas of interest where buyers and/or sellers are most engaged.
Putting It All Together
It is not about memorizing all patterns or indicators. It’s about using different tools together to make a smart choice. Here is a step-by-step approach to crypto charts analysis:
- Determine the trend with moving averages or trend lines
- Identify major support and resistance points
- Employ candlestick patterns for short-term entry signals
- Verify strength with volume
- Employ indicators such as RSI or MACD
- Observe multiple time frames for correlation
Conclusion
Reading crypto charts are both a skill and an art. With time, practice, and discipline, you’ll develop an intuitive understanding of how markets move. Don’t try to master every tool at once. Start simple, understand candlesticks, support/resistance, and moving averages. Once you’re confident, gradually incorporate advanced tools like RSI, MACD, and Fibonacci retracements.
The more you understand, the stronger your own trading choices are. Crypto charts never predict the future, but they do give clues. Use them wisely and let them be your guide, not your master.
