Cryptocurrency exchanges will appear overwhelming at first, especially if you are going up against colored graphs with squiggly lines, candlesticks, and second-by-second fluctuating numbers. Don’t worry, just as with any language, after you get past the process of learning the basics, you will have absolutely no trouble reading the crypto chart.
Here in this guide, we’re going to simplify all you want to know about what crypto charts are saying to you, why you should care, and how to use them to enhance your trading. Whether you wish to invest long-term or are interested in being an active trader, chart literacy is your key to confidence.
Table of Contents
What Is a Crypto Chart?

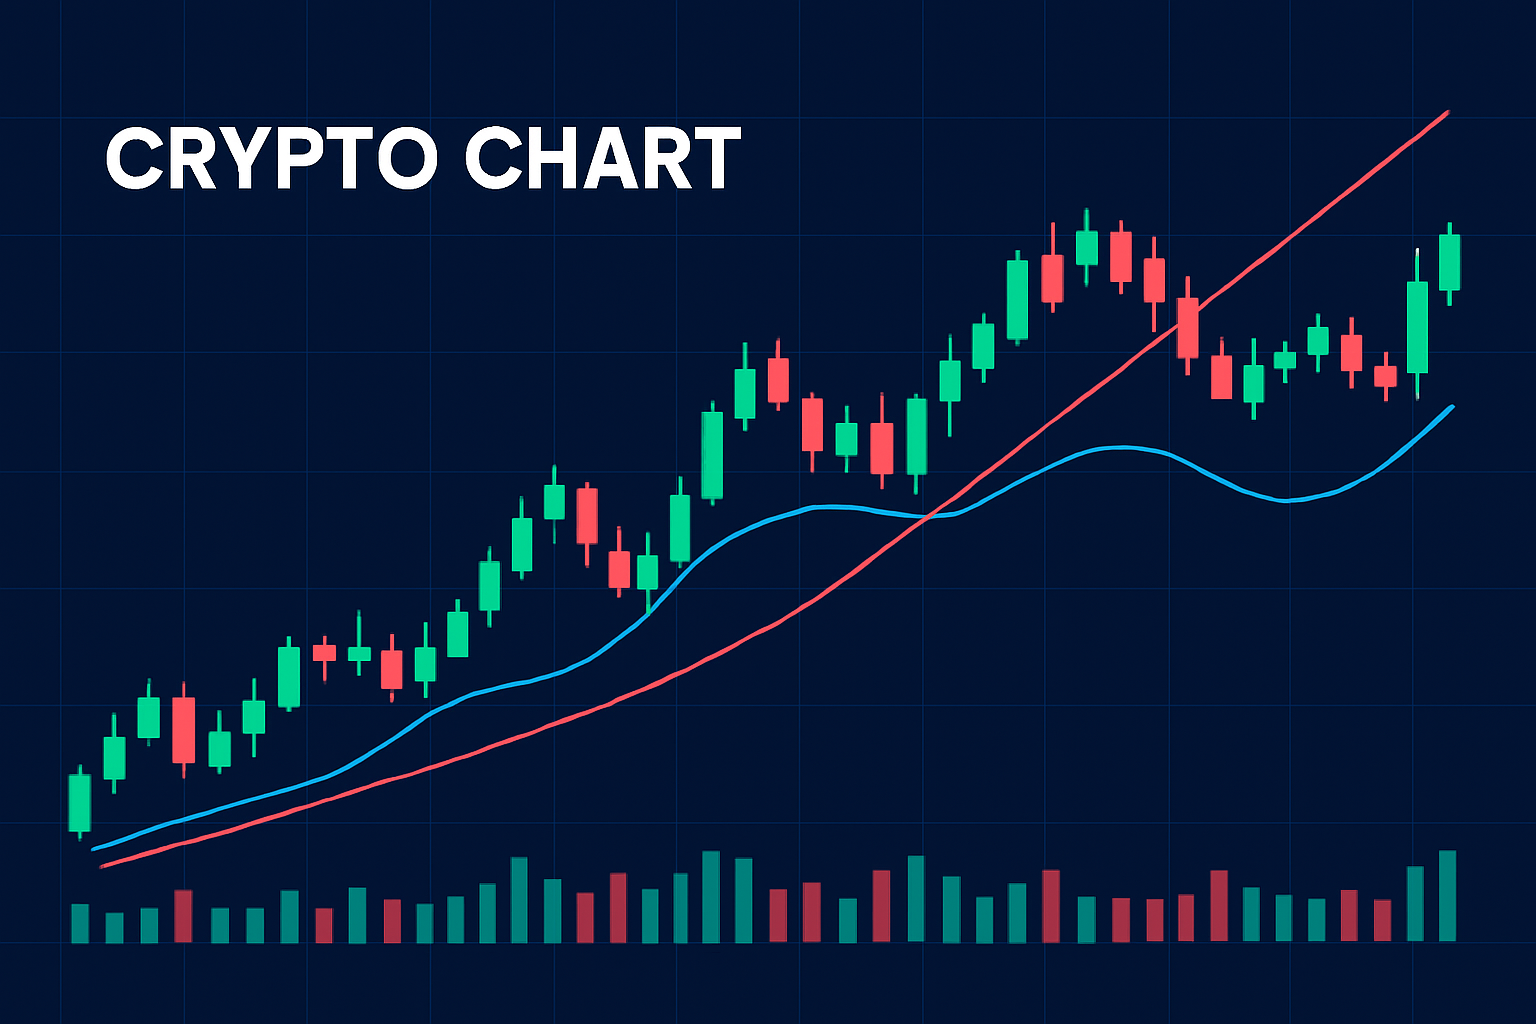
A crypto chart is a graphical representation of the price action of a cryptocurrency over a specific period. It helps traders and investors analyze patterns, trends, and the possible future movement of the price.
The most widely used type of crypto chart is the candlestick chart, although line charts and bar charts are also utilized. All of these types show the price movement of a coin or token so that you can visualize market action at a glance.
Why You Should Learn to Read Crypto Chart
Understanding a crypto chart will provide you with a huge edge, especially in extremely volatile markets like crypto. Here’s why:
- Trends will be easier to spot: Knowing uptrends and downtrends assist with improved timing.
- You’ll make sensible choices: Charts give you facts, not feelings.
- You’ll catch potential reversals early: This could enable you to save losses or enter positions with improved risk/reward ratios.
- You’ll trade with intent: Instead of reacting to panic or euphoria, you’ll be making decisions based on information.
Getting Started: Basic Components of a Crypto Chart
Let’s start with the foundation. A crypto chart includes several key elements:
1. Time Frame
Each graph shows data during a selected time frame between 1 minute and 1 month. For example:
- 1 Minute chart: Ideal for scalping and short-term trading.
- 1 Day chart: Well-liked for swing and long-term trading.
Select a time frame according to your objectives. New traders tend to use daily or 4 hour charts.
2. Price Axis and Time Axis
- Y-axis (vertical) shows price levels.
- X-axis (horizontal) shows time.
3. Candlesticks
Each “candle” shows four pieces of information for a particular time:
- Open: The price at the start of the period.
- Close: The price at the end of the period.
- High: The highest price during the period.
- Low: The lowest price during the period.
Green candles (or white, if the theme permits) typically indicate a move up in price, while red candles represent a decline.
Understanding Trends
Reading charts isn’t just about interpreting individual candles; it’s about spotting the trend.
1. Uptrend (Bullish Market)
- Series of higher highs and higher lows.
- Common during positive market sentiment.
2. Downtrend (Bearish Market)
- Characterized by a succession of lower highs and lower lows.
- Reflects bearish sentiment.
3. Sideways Trend (Consolidation)
- Prices move within a range.
- Shows market indecision or accumulation before breakouts.
Tip: Draw a trendline connecting lows during an uptrend or tops in a downtrend. Provides insight into trend strength.
Read more about crypto: what is spot trading in crypto and why it matters for BEGINNERs
Essential Tools and Indicators
To level up your crypto chart reading, you’ll want to use tools called technical indicators. These are calculations based on price, volume, or other data points that provide insights into trends, momentum, and more.
1. Moving Averages (MA)
Moving averages trim price data to show the average over a defined number of periods.
- Simple Moving Average (SMA): Average over a given time span (e.g., 50-day SMA).
- Exponential Moving Average (EMA): Roughly the same, but gives more weight to recent prices.
Use them to confirm trends or spot reversals. For example, if price breaks through the 200 day EMA, that may signal the start of an uptrend.
2. Relative Strength Index (RSI)
RSI suggests momentum and measures overbought or oversold levels.
• More than 70: Possibly overbought.
• Less than 30: Maybe oversold.
Very good at determining entry and exit points.
3. MACD (Moving Average Convergence Divergence)
Shows changes in momentum by comparing two EMAs. When the MACD line crosses the signal line:
• Upward crossover: Might signal a buy.
• Downward crossover: Might signal a sell.
4. Volume
Volume tells you the amount of a cryptocurrency that is being traded. Healthy volume supports the authenticity of a price movement.
Support and Resistance

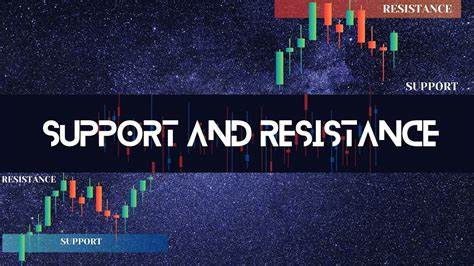
Support and resistance are key price levels that markets will tend to respect.
• Support: A price level where demand is strong enough to stop a decline.
• Resistance: A level where selling pressure is strong enough to stop an advance.
These levels assist traders in locating key places to purchase or sell. Once the levels are breached, they tend to reverse functions (support turns into resistance and vice versa).
Chart Patterns to Know
There are certain price trends that repeat in crypto charts. Recognizing these can allow you to foresee future direction.
- Head and Shoulders
Signals a reversal. The three peaks of the pattern are:
- Left shoulder
- Higher head
- Right shoulder
A breakdown below the neckline can indicate a decline.
- Double Top/Bottom
Double tops are bearish (two highs in the same area), and double bottoms are bullish (two lows).
3. Triangles (Symmetrical, Ascending, Descending)
These patterns indicate consolidation and often precede a breakout.
- Ascending triangle: Bullish
- Descending triangle: Bearish
Symmetrical triangle: Neutral watch for breakout direction
Putting It All Together: Reading Like a Pro
Once you’ve mastered the basics, this is how you put it all together:
Step 1: Set Your Time Frame
Establish whether you’re trading short, medium, or long term. Set a time frame as a result.
Step 2: Identify the Trend
Use trendlines and moving averages to find out whether the market is on the way up, the way down, or trending sideways.
Step 3: Mark Support and Resistance Levels
Plot horizontal lines where price previously reversed.
Step 4: Use Indicators
Confirm the trend with RSI, MACD, or other indicators. Don’t complicate things, 2 to 3 indicators work.
Step 5: Look for Patterns
See if there are any chart patterns forming. Compare what you see with prior results.
Step 6: Watch Volume
Volume spikes will confirm breakouts or signal reversals of trends.
Mistakes to Avoid
- Excessive indicators: It should be simple and clear.
- Ignoring the bigger picture: Zoom out regularly.
- Emotional trading: Go by the chart, not the news.
- Failing to test your strategy: Use demo accounts or backtesting software.
Practice Makes Perfect
Learning through doing. Practice reading charts on sites like TradingView. You don’t need to make trades to learn, you observe and take notes.
Set aside some time each day to:
• Study from old charts
• Practice drawing trendlines
• Study from old price action
• Track one or two coins in detail
Final Thoughts: Your Journey Begins Now
Reading charts is a skill, not a talent. It is not genius IQ required, but self-discipline, persistence, and curiosity. Through the development of the art of reading crypto charts, you will be smarter, reduce risk, and have a solid foundation for whatever strategy you desire to implement.
It’s okay to be new. Every expert was once a beginner staring at a screen, wondering what those squiggly lines meant. Stick with it, and soon you’ll be the one explaining charts to others with confidence and clarity.
