The first time you go into investing or trading the world; be it stocks, commodities, or even virtual ones like cryptocurrencies, you would immediately be presented with two simple words: support and resistance. They are technical analysis support columns that would teach traders when to sell and when to buy. Perhaps intimidating, support and resistance are not when explained properly.
This blog will break them down as simply as possible, with simple examples and helpful tips. If you are a beginner looking to learn more or someone who needs to brush up on the basics, this tutorial will take you through everything you need to know about support and resistance, why they are useful, how to identify them, and how traders use them to make educated decisions.

Table of Contents
What Is Support?
Let’s start with support. Think of it as a kind of price floor for a financial asset.
Definition of Support
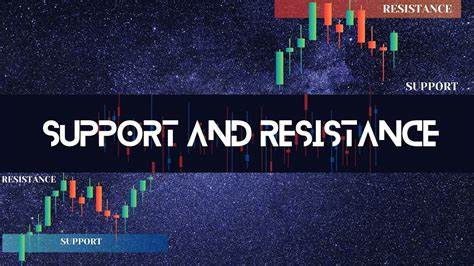
Support refers to the price level at which an asset will most probably bottom out and start recovering upward. Support resembles a cushion or a “floor” below which the price is immune to falling. This is because at this price level, many buyers are willing to purchase the asset, hence generating demand that will not allow the price to fall any further.
Real-Life Analogy:
Consider dropping a ball onto the floor. The floor prevents the ball from continuing to drop and tends to bounce it back. Similarly, the degree of support prevents the price from going lower at least temporarily.
Why Support Forms
Support forms due to:
- Buyer demand: There are more buyers entering the market at lower prices.
- Market psychology: Investors remember past price levels at which reversals occurred.
- Core catalysts: Events or news that legitimize the current low as undervalued.
What Is Resistance?
Now, let’s look at resistance. If support is the floor, resistance is the ceiling.
Resistance is the price level at which an asset will typically stop going up and may start to fall. It’s like a ceiling where the price has difficulty breaking through. This is because sellers enter at this level of price, introducing supply and preventing upward movement.
Real-Life Analogy
Picture a balloon rising and colliding with the ceiling. Unless it breaks through, the ceiling prevents it from moving forward. Resistance is the same, capping the price from going higher.
Why Resistance Happens
Resistance usually arises because of:
- Seller pressure: Sellers are inclined to sell the asset at higher prices.
- Profit-taking: The earlier buyers would sell in order to make profits.
- Market memory: Traders remember past highs and expect the same to happen.
Read more: why most traders ignore market structure – and pay the price
The Role of Psychology
Support and resistance levels are not just numbers. They’re very much psychologically driven.
Fear and Greed
Markets are emotional. Fear of loss and greed for gain play a big role in why prices no longer keep going up or down past certain points.
Herd Behavior
When sets of traders agree that a particular level is important, they all confirm the level with their activity. For example, if many traders view $50 as a good price at which to purchase a stock, they’ll purchase when it’s at $50. Group activity lends support.
How to Identify Support and Resistance Levels
You don’t need fancy tools to identify support and resistance. Here are a few simple methods:
1. Historical Price Points
Look at the chart and note levels where the price has previously reversed. They often become future resistance or support.
2. Round Numbers
Prices ending in .00, .50, or other even figures are often psychological barriers. For example, $100 or $10,000 could be strong resistance levels simply because they are big numbers.
3. Moving Averages
Simple moving averages (like the 50-day or 200-day) can also be dynamic levels of support or resistance.
4. Trend Lines

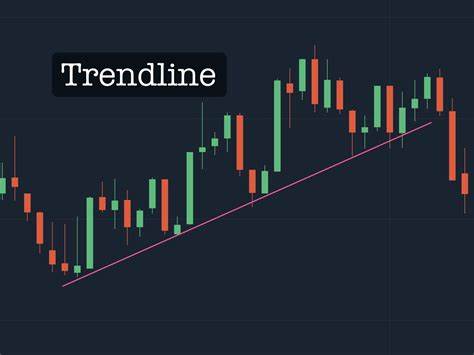
Drawing lines between lows (for support) or highs (for resistance) of a trend of prices can help draw these levels out.
5. Volume at Price
Volume indicators can show the level of activity that occurred at different price levels. Higher volume suggests stronger support or resistance.
Support and Resistance in Action
Let’s go through a basic example to see how this works in real trading:
Example:
You’re looking at a stock that just fell from $100 to $80, then bounced back to $85, then fell again. You notice that:
- The price doesn’t fall below $80 = Support
- The price finds it hard to go above $85 = Resistance
So, support is at $80 and resistance is at $85. Traders would be keeping a close eye on whether the price approaches either level again.
What Happens When Support or Resistance Breaks?
Here’s where things get interesting.
Breakout
When price moves past a level of resistance, it is in a state of breakout. It may represent the start of a new rising trend, but only if with high volume.
Breakdown
When the price falls below a support level, it’s known as a breakdown. This could be a sign of further fall.
Role Reversal
A support or resistance level that has been broken can become resistance or support, respectively. This is known as role reversal.
Example:
- A stock penetrates a $100 resistance level and moves up to $110.
- It then drops back to $100 but recovers again.
- Now, $100 has become support.
Support and Resistance Are Not Exact
Support and resistance are not exact points, but ranges. The market is not always that specific. You can see prices trending up a little above, or down a little below, these levels before reversing.
False Breakouts
At times, the price will appear to break through a level but snap right back instantly. This is a false breakdown and can trap some traders who react too quickly.
Tools to Help Identify Support and Resistance
Although you can identify support and resistance by hand, numerous tools can assist:
- MetaTrader or TradingView platforms
- Indicators like Bollinger Bands or Fibonacci Retracement
- Chart patterns like double tops/bottoms, triangles, and channels.
They add confidence to your analysis but are most powerful when combined with observation.
Why Support and Resistance Matter
Understanding these concepts is important because they help you:
- Improve Entry and Exit Points
Knowing where prices can reverse helps you time your trades better. - Set Realistic Targets
Support and resistance give you natural places for setting profit-taking and stop-loss levels. - Understand Market Behavior
These levels tell you what the overall market is thinking. They reflect collective perceptions of value and risk. - Reduce Danger
Buying in the area of support or resistance can yield clearer risk-reward situations.
Common Mistakes to Avoid
Even experienced traders occasionally make mistakes. Here are a few things to be aware of:
- Chasing Breakouts Without Confirmation: Always wait for confirmation via volume or candle.
- Overlooking Broader Market Context: Never look at support/resistance in isolation.
- Relying on Only One Tool: Use multiple indicators for confirmation.
- Being Too Specific: Keep in mind, these are zones; not specific prices.
Support and Resistance in Different Markets
Support and resistance principles apply everywhere and to any form of financial market:

- Stocks: Commonly employed in technical trading methods.
- Cryptocurrencies: Especially useful due to hyper volatility.
- Forex: Typically used by currency traders to determine turning points.
- Commodities: Oil, gold, and other commodities are likely to respect traditional resistance and support.
Final Thoughts
Support and resistance are simple yet convincing concepts that guide decision in capital markets. Think of them as the not so visible lines on a price graph that speculators track to understand where an asset is ready to reverse direction or continue. They don’t predict what will happen next, but they will show you what the market has done previously and perhaps what it’s going to do once more.
By gaining the skill to recognize these levels, you become empowered to make better, more assertive decisions. Whether you’re trading short or long term, knowledge of support and resistance will be a powerful cornerstone to your career as a trader.
