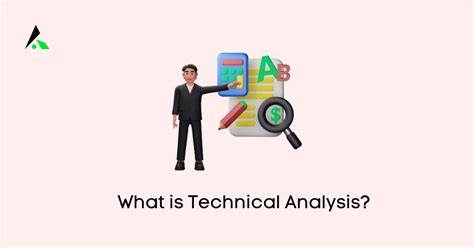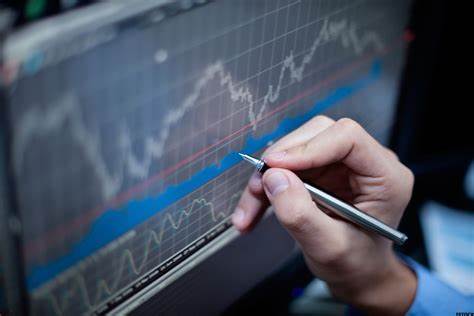
Technical analysis for crypto is the study of market data primarily price and volume to foreshadow future price movements. Instead of analyzing a project’s technology or team, technical analysts rely on charts and trading indicators to inform their decisions.
The method is employed everywhere in all markets, from stocks to forex to now cryptocurrency. The goal? Spot patterns, understand trends, and foresee possible shifts in price.
Why Technical Analysis for Crypto Is Important
The crypto market is volatile, 24/7 available, and demand and supply based. This is the perfect environment for technical analysis.
Here’s why you need to learn it:
- No dependency on news alone: Although news impacts prices, technical analysis tells you about what is already happening in the charts.
- Better entry and exit points: Learn to time your buys and sells better.
- Greater confidence: Instead of winging it, let trends and data guide your moves.
Preparing Your Workspace for Technical Analysis
You’re going to need the setup in place before you start hammering away at tools and techniques.
1. Charting Platform
Choose a platform like:
TradingView is ideal for beginners because of free tools and large user base.
2. Exchange Integration
Link your charting package to the exchange you operate on (like Binance, Bybit, or KuCoin) so that you can see live prices and plot from live charts.
3. Clean Workspace
Start with a blank chart. Don’t overload it. Add only what you need price chart, volume bar, and maybe one or two indicators.
Knowing Price Charts in Technical Analysis for Crypto
There are several types of charts but focus on candlestick charts initially.
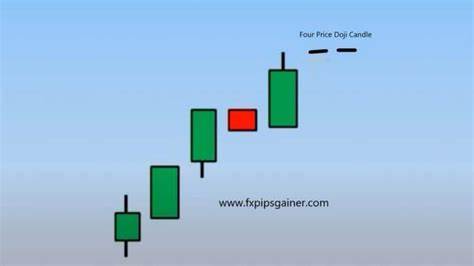
What Are Candlesticks?
Each candlestick represents four key price levels:

- Open – Price at the start of the interval
- Close – Price at the end of the interval
- High – Top of the period
- Low – Bottom of the period
The color reflects whether the price went up (green) or down (red).
Time Frames
You can view charts in different time frames:
- 1-minute chart: Best for scalping or intra-day analysis
- 1-hour to 4-hour: Best for day trading
- Daily or Weekly: Best for swing or long-term trading
Mastering Support and Resistance
They are the foundation of technical analysis of crypto.
Support
Support is a price level where demand is so strong that it cannot let the price fall any further. It is a “floor.”
Resistance
Resistance is the opposite where selling pressure won’t let price move any higher. It’s like a “ceiling.”
When a support or resistance level is broken, it tends to reverse support becomes resistance and vice versa.
Read Also: What is the DIFFERENCE between support and RESISTANCE? explained simply
Popular Indicators Used in Technical Analysis for Crypto

Indicators are charting package features intended to help you analyze price action.
1. Moving Averages (MA)
Smooths out price data in order to identify trends.
- Simple Moving Average (SMA): Average over a set number of periods
- Exponential Moving Average (EMA): Gives more weight to newer data
Use two MAs (e.g. 50-day and 200-day) to calculate golden and death crosses.
2. Relative Strength Index (RSI)
Shows whether a coin is overbought (>70) or oversold (<30). Great for picking up on possible reversals.
3. MACD (Moving Average Convergence Divergence)
Helps to decide trend direction and momentum. Keep an eye out for crossovers and price/MACD line divergence.
4. Volume
Volume confirms strength of move. Big volume = strong conviction. Thin volume? The move won’t last.
Trends in Technical Analysis for Crypto
A trend is the general direction the market is moving.
Types of Trends:
- Higher highs and higher lows: Uptrend
- Lower highs and lower lows: Downtrend
- Price fluctuates in a range without direction: Sideways
Trendlines
Drawing trendlines helps it become easier to observe these movements and spot breakout points.
Read More: Top 7 Altcoins to Watch in 2025 (With Entry & Exit Points)
Chart Patterns Every Beginner Needs to Know
Patterns help you forecast price movements. Some of the most critical ones are listed below:
1. Head and Shoulders
- Signals a reversal of trend
- Common in tops and bottoms
2. Double Top / Bottom
- Two hills or troughs at roughly the same level
- Signals reversal or strong support/resistance
3. Triangles
- Upside: Bullish
- Downside: Bearish
- Symmetrical: May go either way, depending on breakout direction
Risk Management in Technical Analysis for Crypto
Good technical analysis will not save the day if there is no risk management.
- Set Stop-Losses
Cover yourself always. A stop-loss will automatically close your trade as soon as the price hits a certain level. - Position Sizing
Never risk more than 1–2% of your capital on one trade. - Risk-to-Reward Ratio
Look for trades where possible reward will be at least 2–3 times the risk.
Combining Technical and Fundamental Analysis
While technical analysis of crypto is solid, it’s even stronger if you layer in simple fundamentals.
For example:
- Use news to identify trending coins.
- Then use charts to identify entry and exit points.
This mix gives you an edge no matter what the market.
Practice Makes Perfect: Backtesting and Paper Trading
Trade first with a practice account before dealing with real money.
Backtesting
Apply your strategy using historical data. This will allow you to understand how it would have acted.
Paper Trading
Practice real-time trading without risking money using demo accounts. Most platforms like TradingView have paper trading features.
Developing a Personal Trading Plan
Technical analysis tools only as good as your plan. Develop a plan which suits your personality, risk tolerance, and time commitment.
Sample Plan:
- take 4-hour chart
- define trend through 50 EMA
- confirm momentum with RSI
- enter on breakout with heavy volume
- set stop-loss below support
Avoiding Common Pitfalls in Technical Analysis for Crypto
- Overloading on indicators
- Ignoring market structure
- Risk management forgotten
- Trade plan-less
- Chasing pumps or hype
Be disciplined and wait for consistency.
Summary: Your Beginner Roadmap
Let’s quickly recap the essentials of technical analysis for crypto:
- Understand candlestick charts
- Identify support and resistance
- Learn and use key indicators
- Spot patterns and trends
- Always manage your risk
- Practice before going live
- Stay patient and focused
By following this full beginner course, you’ll gain the confidence and skills needed to read crypto charts like a pro.
CONCLUSION
Learning how to do crypto technical analysis is a powerful step towards more intelligent investing and trading. It’s not supposed to mean seeing the future with 100% certainty it’s supposed to mean enhancing your odds and making rational decision based on evidence.
Spend time to learn, practice, and perfect your method. The cryptocurrency market is a prize for being prepared. Your journey of technical analysis starts today embrace it with curiosity and discipline.
